
Analyses of WMAP first/third-year data
e-print: astro-ph/05120020
Intro
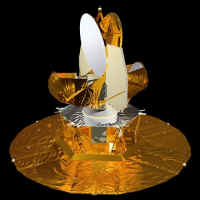 The Wilkinson Microwave Anisotropy Probe (WMAP) is measuring cosmological microwave background radiation (CMB) - the footprint of the Big Bang. The probe detects tiny sky temperature fluctuations (anisotropy) by two identical antennas looking at directions separated by 141 degrees.
The satellite rounds the L2 point in the Sun-Earth system. It also spins in 2.2 min period and precesses in 1 hour the Sun-Earth axis, with 22.5 deg. half-angle.
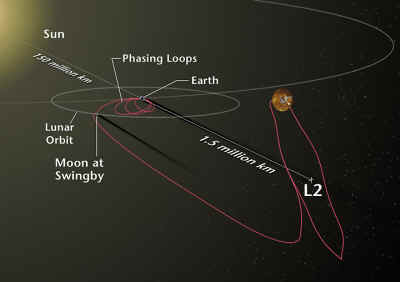
The WMAP scanning strategy (mainly 1 hour precession) results in non-uniform sky coverage with higher number of observations in the directions of ecliptic poles and rings around them of 45 deg. radius. See also WMAP NASA site (the left and above pictures are from this place).
The gradient pattern
We derived gradient maps of single differencing assemblies (foreground-cleaned) in different WMAP channels.
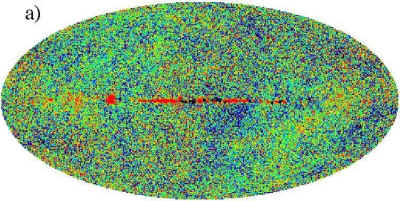
| WMAP V2 channel map (HEALPix NSIDE=512). Mollveide projection of galactic coordinates. High temperature signal is red.
|  |
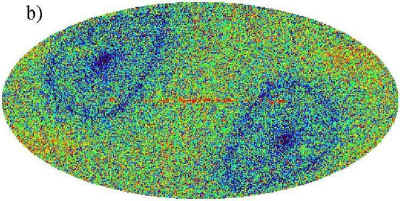
| Gradient map of the WMAP V2 channel map (NSIDE=512). Large gradient is red.
|  |
| Convolved gradient map of the WMAP V2 channel map (NSIDE=512, Gaussian beam of 3 deg.). For all experiments a convolved gradient map better underline the gradient pattern. | 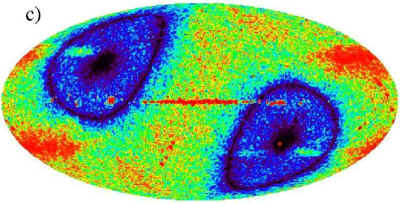 |
| Gradient map of the effective number (time) of observations in V2 channel (NSIDE=512). Red color corresponds to higher numbers. | 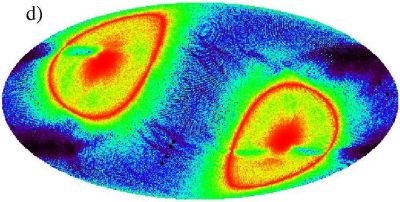 |
| Why those systematics are visible in the WMAP data? The gradient maps reveal a strong pattern resembling structures in the map of the effective number of observations and which results from non-uniform sky coverage by the WMAP satellite (compare figs c and d above and recall our Intro). The more time spent by the WMAP the less instrumental fluctuations (noise) in those regions and less gradient. Blue regions around ecliptic poles and rings of low gradient correspond exactly to high sampling areas of the WMAP data. The instrumental noise distribution can affect WMAP CMB studies, especially those discussing large scale structure, non-gaussianity or low-l power spectra. See for details: Chyży K.T., B. Novosyadlyj, M. Ostrowski, astro-ph/05120020. |
Gradient of coadded maps
We also calculated the gradient map from the inverse-noise-square weighted coadded map. The individual assemblies maps (Q1, Q2, V1, V2, W1, W2, W3, W4) were combined using weighting including the information on the effective number of observations in each sky-point and instrumental noise of each single map.
| Gradient of inverse - noise - squared coadded map |  |
| A zoomed gradient map of coadded map. The presented region shows places where planets were visible during the WMAP observations. Higher noise (and gradient) is a result of flagged such data. |  |
Sobol image analysis
We also applied to the WMAP sky maps Sobol filter known as a powerful tool in image-analysis. It is also a kind of "mean" gradient operator.
| Sobol map of W4 channel (NSIDE=512) in Mollweide projection of galactic coordinates. | 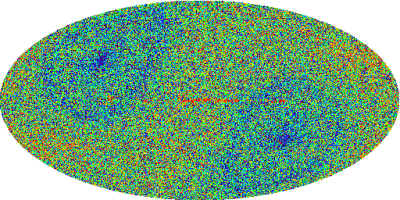 |
| Sobol map of W4 channel (NSIDE=512) in Orthographic projection of ecliptic coordinates. | 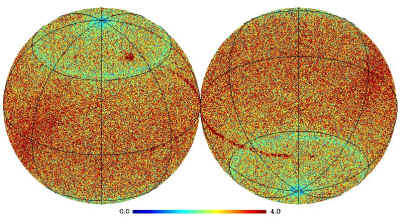 |
The gradient method reveals the details of WMAP sky coverage
| Gradient map of the effective number (time) of observations in the V2 WMAP channel. Details of complex sky coverage pattern is well visible. | 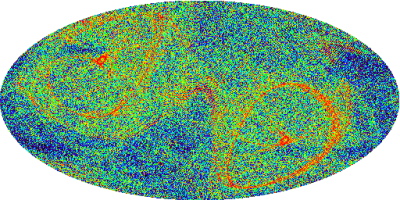 |
| As above but zoomed view at the northern galactic pole. | 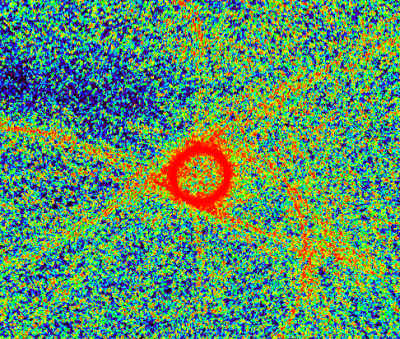 |
| Smoothed (1 deg Gaussian beam) gradient map of the effective number of observations in the V2 sky map. | 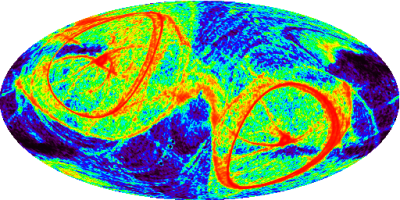 |