
Astronomy Object of the Month: 2023, February
< previous Archive next >
13 years of monitoring the optical variability of quasars at OAUJ
Active galaxies are some of the most energetic objects in the Universe. Processes of accretion of
matter onto supermassive black holes occur in their active nuclei
(AGNs), constituting a source of radiation
over a wide range of the electromagnetic spectrum. They are also objects exhibiting radiation variability.
Studying the nature of this observed variability we can analyse the physical processes responsible for changes
in the brightness of the active nucleus.
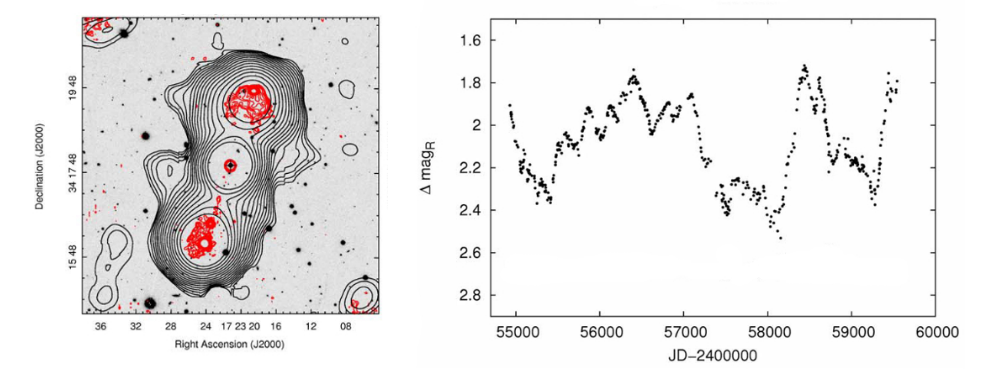
Illustration 1:
Left: Optical image from the Pan-STARRS survey, centred on one of the observed quasar [HB89]
1721+343. The optical image has been overlaid with radio contours from the NVSS (black colour)
and FIRST (red) surveys. Right: Thirteen-year light curve of [HB89] 1721+343 quasar.
Credit: The Authors.
The physical processes behind the variability in the optical range (on time scales from days to decades) are the subject of numerous studies. Theoretical considerations suggest that several mechanisms can explain both the time scales and the amplitudes of the brightness variations observed in AGNs. These may include instabilities in the accretion disk, processes associated with the evolution of massive stars that explode as supernovae, or variabilities caused by the gravitational microlensing. Each of these mechanisms results in a different character of variability, possible to study using statistical methods.
In 2009, systematic monitoring of the optical variability of the eight quasars has started in our Observatory. The selected objects have extended radio structures, with five of which are classified as so-called giant radio quasars, with sizes exceeding 0.7 Mpc. Initially, observations were performed using a fifty centimetre Cassegrain telescope located at the Astronomical Observatory of the Jagiellonian University. However, after some time, the telescope located at Suhora Observatory (UP) has also been used for the observations, as well as the telescopes belonging to the network of robotic telescopes – SKYNET. Thanks to the many people involved in the observations, it has been possible to obtain the light curves of the quasars, covering 13-year period of their variability. These are unique data not only because of the length of the observations period in question, but also due to the frequent sampling – the observations of each quasar were made on average 3 times a month.
The obtained light curves were used to investigate the characteristic time scales of the variation and the physical process that would explain the observed nature of the variation. For this purpose, two statistical methods was used: the so-called structure function (FS) analysis and power spectral density analysis (PSD). Based on the obtained FS and PSD slopes, it can be estimated that the most likely process that could be responsible for the variability of the observed quasars is the instabilities of the accretion disk, and the nature of this variability can be described as red noise or a damped random-walk process. Our analyses have also shown that the characteristic time scales of the variability of this type of objects are much longer than their monitoring time so far. They can span up to several hundred or even millions years, which is not achievable using conventional single-object observation methods.
An interesting though not fully understood obtained result is a strong anti-correlation between the size of radio structures and the slope of the PSD function (correlation coefficient of 0.86). The anti-correlation may indicate some link between the size of the radio source and the nature of its variability, but it is now based on data for eight objects only, making further study of a larger sample of this kind of objects necessary to confirm it.
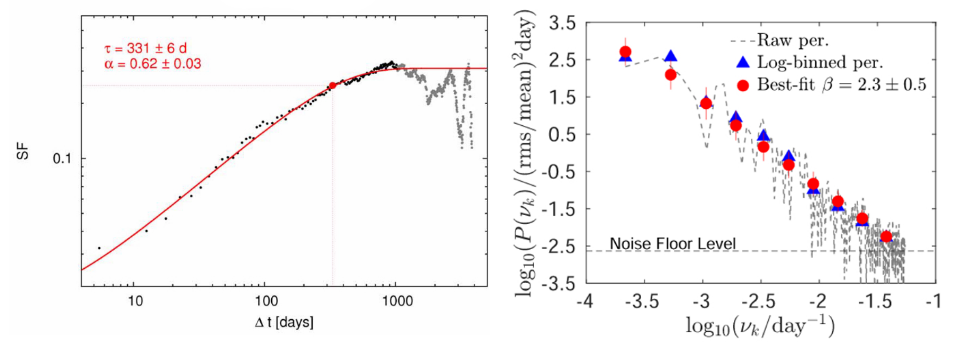
Illustration 2:
Structure function for [HB89] 1721+343. The plot shows the value of the coefficient of the FS
slope (α) and the inflection point (τ) corresponding to the characteristic time scale of the
variability. Right: PSD function for [HB89] 1721+343 with the value of PSD slope (β) given.
Credit: The Authors.
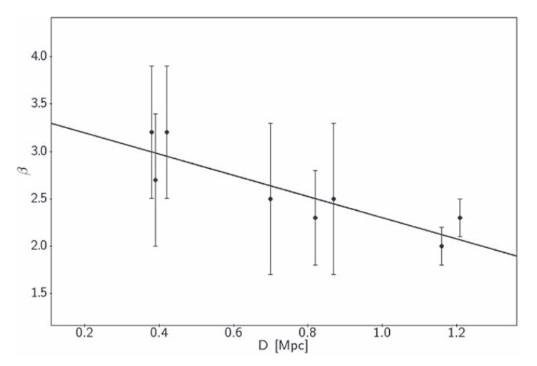
Illustration 3:
The anti-correlation between the slope of the PSD function (β) and the size of the radio structure of quasars.
Credit: The Authors.
Original publication: A. Kuźmicz et al., Optical Variability of Eight FRII-type Quasars with 13 yr Photometric Light Curves, ApJS 263 16 (2022).
The research was conducted at the Department of Stellar and Extragalactic Astronomy and Department of Radioastronomy and Space Physics of the Jagiellonian University’s Astronomical Observatory (OA UJ). This research was supported by the Polish National Science Centre grants UMO-2018/29/B/ST9/01793 and UMO-2018/29/B/ST9/02298. The quasar light-curve simulations were performed using the PLGrid Infrastructure.
|
Agnieszka Kuźmicz Astronomical Observatory Jagiellonian University A.Kuzmicz [@] uj.edu.pl |
