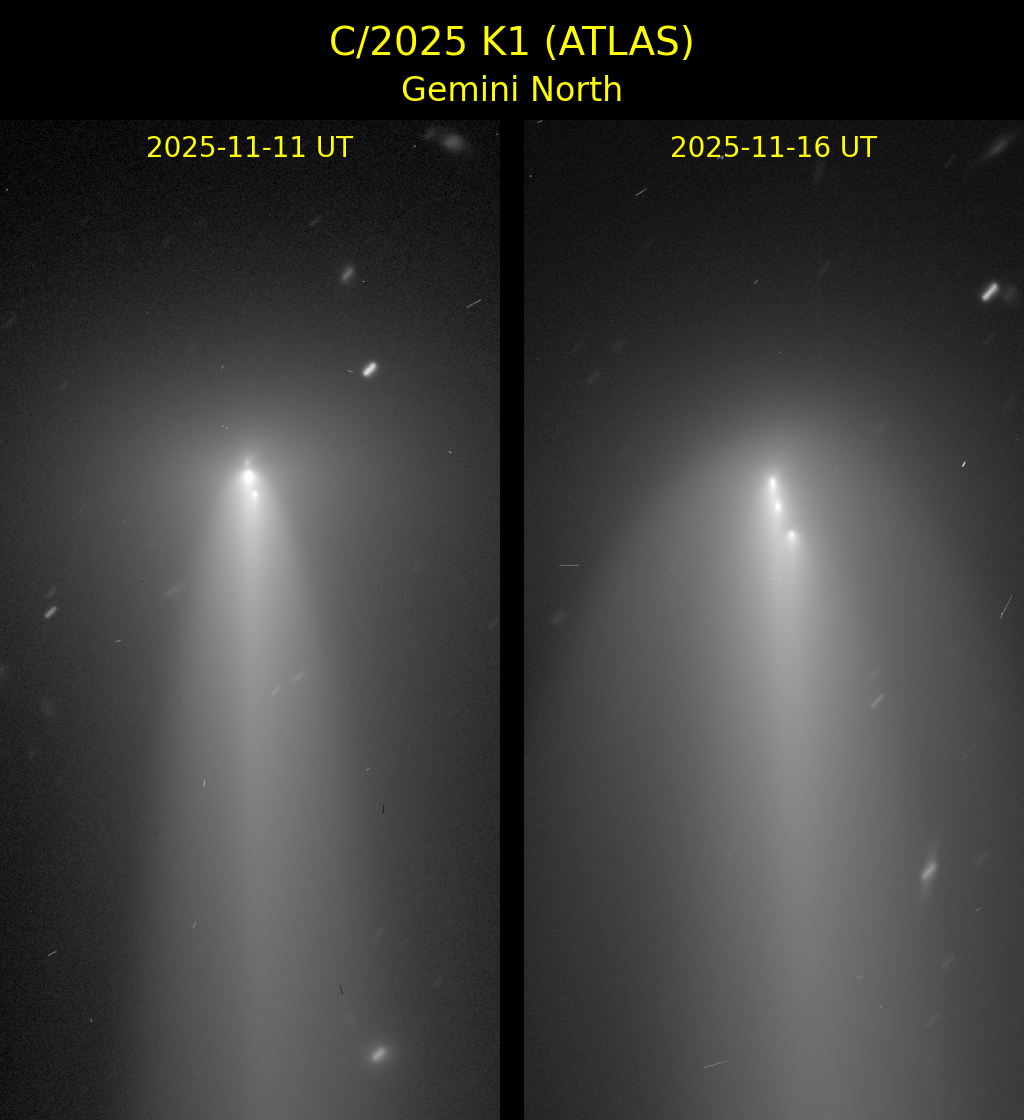
Fig. 1. Wide-field r-band images demonstrating the overall dust-tail and coma morphology (each panel covering 120x60 arcsec). The apparent difference in spatial sampling between the two epochs in the zoomed views reflects the change from 2x2 to 1x1 on-chip binning.
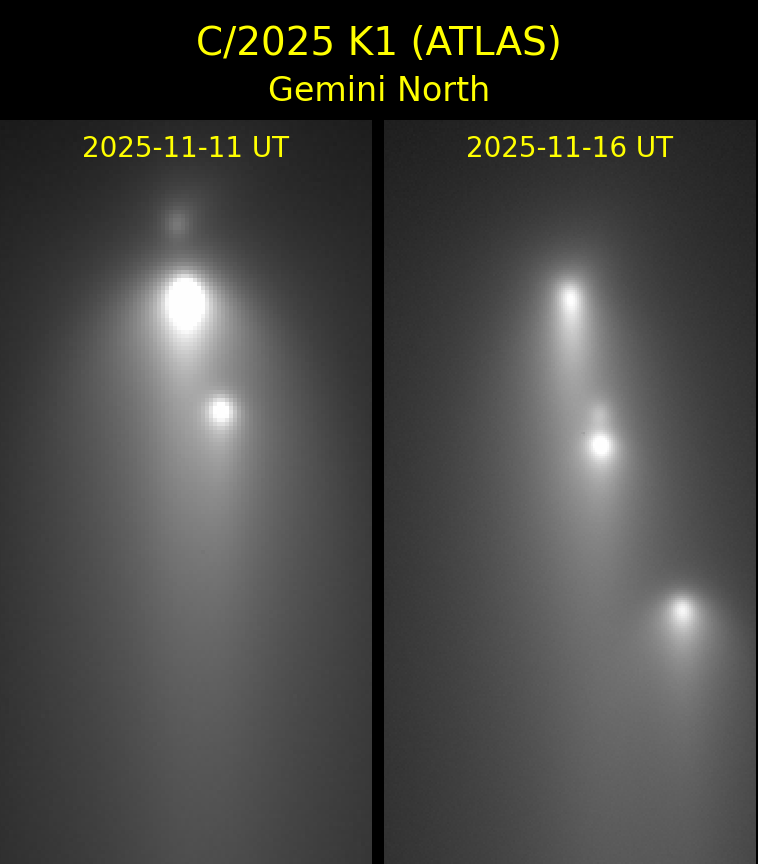
Fig. 2. Zoom-ins centered on the nuclear region with brightness scaling optimized to highlight the individual fragments (each panel covering 30x15 arcsec). The apparent difference in spatial sampling between the two epochs in the zoomed views reflects the change from 2x2 to 1x1 on-chip binning.